 Gallatin Systems
The administration application provides users at headquarters the facility to author and assign surveys as well as view and report on the data as it enters the system.
Since the application is a portal and all visualization/management components are developed as portlets, each user can customize the user interface to suit his or her particular needs and preferences.
The admin application is accessed via a web browser and was built using Java and the Google Web Toolkit. It is deployed on the Google Application Engine cloud so organizations using the system do not need to maintain their own server infrastructure (thereby keeping hosting costs minimal and alleviating the need for a dedicated support staff).

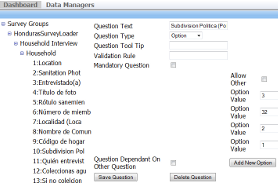
Surveys can be versioned and questions can be shared among multiple surveys to aid in normalization of data elements across localities. Surveys can be defined using a simple web-based editor or imported from a Google Docs spreadsheet. Once surveys are defined, they can be updated at any time and the devices will automatically be updated.

To ensure the right survey is being administered in the right location, the system provides a visual editor for maintaining survey assignments. Users can assign a survey to a device or group of devices via a simple drag and drop interface. Assignments can be edited at any time and, as soon as an assignment is saved, the impacted devices will be updated upon their next communication with the central server.

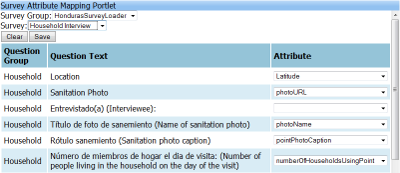
The system supports a framework for defining custom data objects that an organization would like to track/report on. This information can be collected via a subset of the survey responses therefore the application provides a visual mapping tool that allows users to map survey questions to specific fields with their custom data objects. Upon ingest of the data, the system will automatically execute all mappings and update saved data structures with the latest results.
If enabled, the devices in the field will report their current status and location to the central server at regular intervals. This allows a survey coordinator an at-a-glance view of where each device is currently located and the last time it was able to communicate with the server.

When data comes into the system directly from the device or via a data upload utility, it will immediately run it through a series of functions for data aggregation and augmentation. One example of this augmentation is for geographic information: when survey data marked as "geo" data enters the system, the coordinates are passed to a set of web services that augment the latitude/longitude information with details about the country/region in which those coordinates are located.
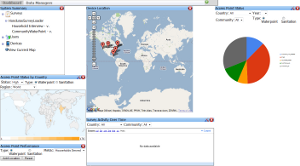
A rich set of charts/graphs are provided to give users the ability to see survey results as they become available. Most of the visualization portlets support a number of configuration parameters thus enabling the users to slice and dice the data in various ways.
Since it is impossible to foresee all ways the data can be analyzed in advance, the system provides a set of API methods that allow data to be exported for use in other tools.
© 2010 Gallatin Systems, LLC