 Gallatin Systems
Our client conducts a high volume of surveys across remote regions of South America, Africa and Asia. These surveys differ by locality and are carried out using pencil and paper. The volunteers who administer the surveys must make decisions as to which questions to answer based on answers to other questions on the surveys. Because of the manual nature of the process, the collection is error-prone, surveys are often incomplete and there is often a multi-month lag between data collection and when it is available at headquarters for analysis.
Gallatin Systems worked with the client to understand the problem and come up with a system that not only automates aspects of data collection, but helps them maintain data quality and, once the data has been collected, helps turn data into information through visualizations and analysis tools.
The system is comprised of two main components: a web application for survey administration and data visualization/analysis, and a data collection application

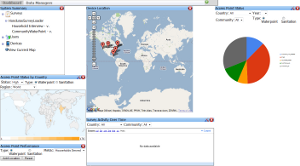
Administration & Analysis Dashboard: A browser-based web application that is used to manage field surveys and interpret the results.
To facilitate the creation of surveys, the system provides simple drag and drop controls that allow users at headquarters to define the questions for a given survey as well as assign the surveys to specific devices.
Once data is collected by users in the field, the system provides access to both raw data and summarized information in the form of tables, charts and graphs in real-time as data is collected.

Data Collection: An Android-based application that provides the ability to submit answers to any survey that has been installed on the device. The collection application supports multiple languages, will automatically download surveys to which it has been assigned, and can automatically report its status to the central server. In addition to surveys, the application supports other collection modes like a geographic region-plotting function.
© 2010 Gallatin Systems, LLC mac